I like to keep on top of my machines health. I like to do this without programs getting in my way, or dedicating desktop space to monitoring applications. The way I’ve found to do this simply and effectively is with the System Monitor panel Applet.
Adding the System Monitor Applet
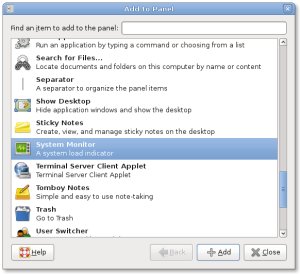
To add the system monitor applet to one of your panels (I prefer the top panel), simply right-click and select “Add to Panel”. Scroll down until you see “System Monitor: A system load indicator”. Select it and select Add. You should now have a small black box on your panel which will monitor cpu activity.
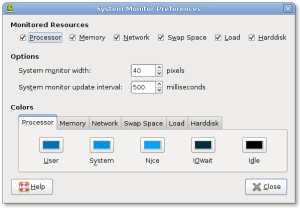
I like to take this one step further and also monitor memory, network, load average, swap and disk activity. This can be done by right-clicking on the new applet and selecting “Preferences”. At the top of this preferences window you have the options of activating the resources you wish to monitor. I check all of these boxes.
As you check each one you’ll get an additional box in your panel. Each one monitors something different and in a different color (customizable). You can now, at a glance, see the cpu load, network usage and all the rest without running any additional applications.
I find this to be a quick, efficient and out-of-the-way method of monitoring my machine.


I find that the most useful stats are load, memory, and processor.
I care most about the IO wait time (I’m not sure why, I just do), so I’ve changed the default colour from a blue that looks almost identical to the other processor colours to red. And presto! The applet is much easier to read.
I think the default update interval is not short enough, especially for CPUs since its usage usually changes dynamically in a short time. So I usually set it to around 100 ms.
The four boxes on my panel are: CPU, RAM, network, and disk I/O.
Not that it’s a major problem but has anyone else noticed that as you mouse-in to the applet (any ‘window’, not just networking) that the network monitor drop to zero?
Try it now – go and download a sufficiently large file (10+ MiB?) and you’ll hopefully see your connection max out, not now mouse in and out of the applet, you’ll see the network monitor graph drop every time you go in. It also annoys me how the graph has no maximum. Not even a configurable fixed maximum. So when my network, on idel, does a random 3kb every 10 seconds it looks like I’m maxing out my connection every 10 seconds for one second. Annoying, but hey.
Like I said it’s not a big problem at all, just annoying. I’ve only have the CPU and network monitors active for this applet but also have another applet on my auto-hide taskbar that textually tells me the download and upload rates separately. So I use the network monitor described here as a general monitor, but if I want to know actual values (so see if I *am* maxing out my connection with a certain download I’ll mouseover my bottom bar to show me the textual rate. I wish I had a network monitor that had a configurable maximum, though, as that would save me needing two applets.
I also change the iowait color, since it’s a dramatically different performance characteristic, but I choose yellow. Red seems a bit antagonistic, I donno. It’s probably a good idea to change the default away from “indistinguishable from black” but it’s also very nearly the perfect storm for “bike shedding”.
Here’s a tip: change the background colour of the graphs to the colour of your panel (use the eyedropper). It looks much better.
(tiny bug – the background starts as black and doesn’t completely update to the selected colour until it has redrawn all the graph to overwrite it).
Great useful postgreat post – very interesting to read your views as a developer on this debate.
down:
Wouldn’t it more interesting for developer to fix these bugs commented? I’ve just checked: mouseover do interrupt the network monitor graph, and its scaling is a nonsence.
how to in unity? in ubuntu 10.04 is easy but in 11.04?